limmo: Luxembourg Housing Price Map
Oct 2025
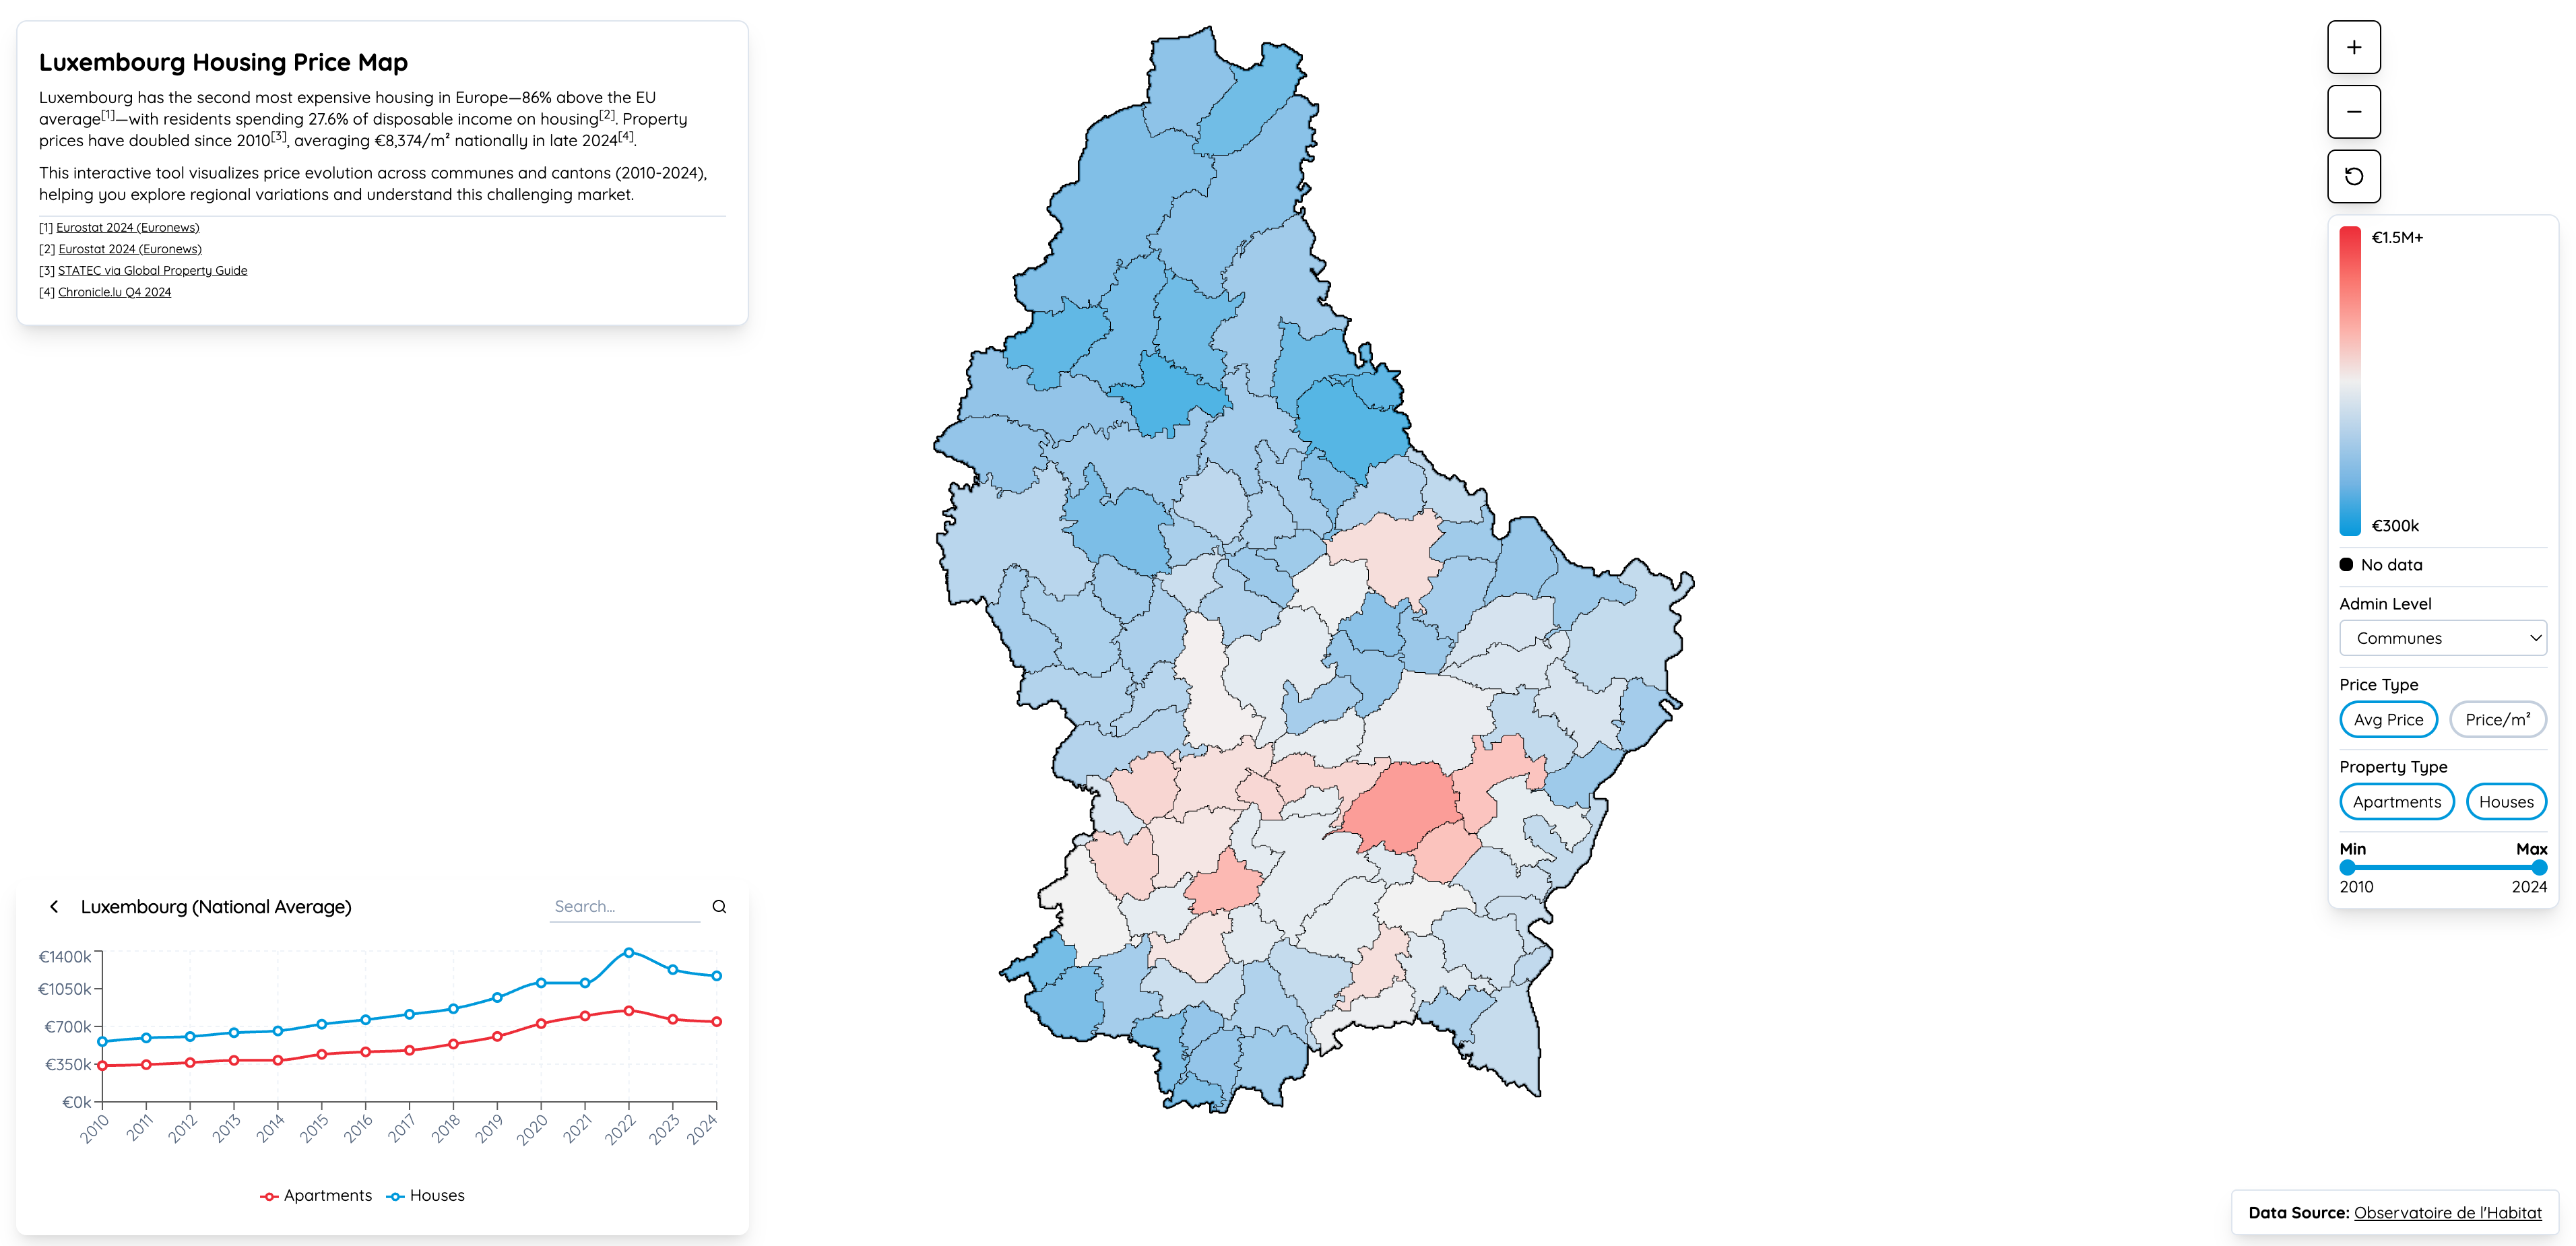
Interactive web application visualizing Luxembourg housing market data across communes from 2010-2024. Built an intuitive map-based interface allowing users to explore house and apartment prices by region, property type, and price percentiles. Implemented dynamic filtering controls and geographic visualization to help users understand real estate pricing trends across Luxembourg. The application provides a free, accessible tool for real estate research and market analysis with responsive design and optimized performance.
Overview
limmo is an interactive web application that visualizes Luxembourg housing prices across all communes, providing an accessible and intuitive tool for exploring real estate market trends from 2010 to 2024.
Key Features
Interactive Map Visualization
- Geographic representation of all Luxembourg communes
- Color-coded pricing indicators for easy visual interpretation
- Responsive SVG-based map for smooth interactions
- Hover effects and tooltips for detailed information
Advanced Filtering System
- Property Type Selection: Filter between houses and apartments
- Price Percentiles: View different price ranges (25th, 50th, 75th percentiles)
- Temporal Analysis: Explore pricing trends across years (2010-2024)
- Real-time map updates based on filter selections
Data Coverage
- Comprehensive commune-level housing data
- Both house and apartment price statistics
- Multi-year historical data for trend analysis
- Regular updates to reflect current market conditions
Technical Implementation
Frontend Architecture
- Modern JavaScript framework with modular design
- SVG-based map rendering for crisp visuals at any scale
- Efficient data loading and caching strategies
- Mobile-responsive layout for all device sizes
Performance Optimization
- Lazy loading of map data
- Optimized asset delivery with CDN
- Minimal bundle size for fast page loads
- Smooth animations and transitions
User Experience
- Intuitive controls requiring no technical knowledge
- Clean, modern interface with Quicksand font family
- Accessible design following web standards
- SEO-optimized for discoverability
Use Cases
For Home Buyers:
- Research neighborhoods and communes
- Compare prices across regions
- Understand long-term pricing trends
- Identify affordable areas
For Real Estate Professionals:
- Market analysis and research
- Client consultations and presentations
- Investment opportunity identification
- Historical trend analysis
For Researchers and Analysts:
- Geographic pricing patterns
- Temporal market dynamics
- Comparative commune analysis
- Data-driven insights
Technical Stack
- Frontend Framework: React with modern JavaScript
- Map Visualization: Custom SVG rendering
- Data Processing: Client-side data transformation
- Styling: Custom CSS with responsive design
- Fonts: Google Fonts (Quicksand)
- Deployment: Static hosting with Vercel
Impact
Accessibility: Free tool available to anyone interested in Luxembourg real estate
Data Transparency: Makes housing market data accessible and understandable
User-Friendly: No technical expertise required to explore complex housing data
Comprehensive: Covers entire Luxembourg with 15 years of historical data
Future Enhancements
- Additional price metrics (mean, min, max prices)
- Price change indicators and trend arrows
- Comparison mode for multiple communes
- Export functionality for data analysis
- API for programmatic access to housing data
- Mobile app version for iOS and Android